Mobile
APP
Hong Kong Odds
- Decimal Odds
- Hong Kong Odds
- Indonesian Odds
- American Odds
- Malay Odds
 English
- English
 Vietnam



Member Ranking
-
1
 Boruto Otsutsuki ⭐⭐⭐🏳️🌈Won 8/10Follow80%Win Rate +44.4%ROI 10Tips 1.91Avg Odds
 -
2
 LuksWon 5/6Follow77.8%Win Rate +43.8%ROI 19Tips 1.91Avg Odds
 -
3
 Simon PhillipsWon 13/17Follow75%Win Rate +33%ROI 20Tips 1.91Avg Odds
 -
4
 Freeman55Won 9/12Follow75%Win Rate +36.6%ROI 12Tips 1.91Avg Odds
 -
5
 Mawen16168Won 6/8Follow73.7%Win Rate +35.7%ROI 20Tips 1.93Avg Odds
 -
6
 NyraWon 15/20Follow72.7%Win Rate +39.4%ROI 22Tips 1.91Avg Odds
Note: Statistics base on data from last 7 or 30 days
More Ranking


Further Reading
-
 Queen Bee 👑 🐝Twanbee Modern has shown a well - balanced offense and defense in this season's K - League. With a 50% win rate, they average 1.4 goals and 1.2 goals conceded per game, and their goal difference is as high as 9. Among their 14 goals, there are many efficient goals scored in key matches. The figure of 5 goals conceded reflects the stability of their defense. An average of 4.2 corner kicks and 1.6 yellow cards per game shows their tactical execution. On the other hand, FC Seoul also has a 50% win rate. However, their average goals conceded per game is 1.4, and the total number of 10 goals conceded exceeds their 12 goals scored. Defensive loopholes are the core problem restricting their competitiveness. Seoul's high - level league data of an average of 6.6 corner kicks per game reflects their aggressive offensive style. But this also puts obvious pressure on their defense, as they conceded more than 1.5 goals in three out of the last five matches. In their historical head - to - head matcAH
 KOR D1
Jeonbuk Hyundai Motors
0-0
FC Seoul
KOR D1
Jeonbuk Hyundai Motors
0-0
FC Seoul
-
 Garoux 777In the historical encounters of the Korean K - League between Chunbuk Hyundai and FC Seoul, Chunbuk Hyundai has had a dismal record at home against FC Seoul. In their last three home games, Chunbuk Hyundai suffered defeats with scores of 1 - 5, 2 - 3, and 0 - 2 respectively. They failed to win any of these three matches. The corner - kick data clearly reveals Chunbuk Hyundai's offensive and defensive weaknesses. In one game, Chunbuk Hyundai only got 4 corner kicks while their opponents had 5. In another, the corner - kick ratio was 6 - 4, indicating that the team has obvious deficiencies in ball - possession organization and offensive efficiency. In comparison... Full - time form is a key factor to consider in this analysis. Full - time Hyundai has played 20 league games this season, with a record of 9 wins, 6 draws, and 5 losses, amassing 33 points to secure a stable second - place in the league. However, they're trailing 9 points behind the league leader, FC Seoul. The title - race sO/UKOR D1
Jeonbuk Hyundai Motors
0-0
FC Seoul
Garoux 777In the historical encounters of the Korean K - League between Chunbuk Hyundai and FC Seoul, Chunbuk Hyundai has had a dismal record at home against FC Seoul. In their last three home games, Chunbuk Hyundai suffered defeats with scores of 1 - 5, 2 - 3, and 0 - 2 respectively. They failed to win any of these three matches. The corner - kick data clearly reveals Chunbuk Hyundai's offensive and defensive weaknesses. In one game, Chunbuk Hyundai only got 4 corner kicks while their opponents had 5. In another, the corner - kick ratio was 6 - 4, indicating that the team has obvious deficiencies in ball - possession organization and offensive efficiency. In comparison... Full - time form is a key factor to consider in this analysis. Full - time Hyundai has played 20 league games this season, with a record of 9 wins, 6 draws, and 5 losses, amassing 33 points to secure a stable second - place in the league. However, they're trailing 9 points behind the league leader, FC Seoul. The title - race sO/UKOR D1
Jeonbuk Hyundai Motors
0-0
FC Seoul
-
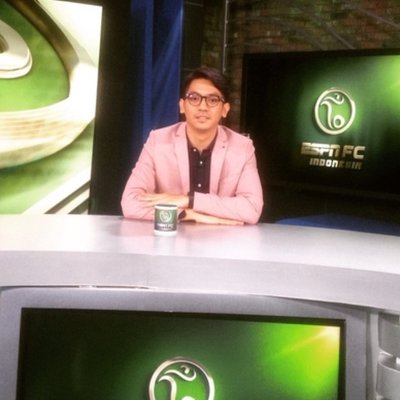 Panji SuryonoJeonbuk Hyundai Motors has long been refining a meticulous midfield passing and control suppression system. The midfielders in the team have a high - level of coordination and rotation. They are good at using continuous ball control and passing to force the opponent's defense to adjust their positions passively and gradually gain the initiative on the field. The team's overall competitive state is consistent and stable, with highly mature tactical implementation. In the recent five games, the average ball - possession rate has reached 55%, and the overall passing success rate is 63%. Their ability to continuously apply pressure and control the game in the front court during positional play is remarkable. However, Jeonbuk Hyundai's ability to adapt to high - intensity physical confrontation is average. When the opponent starts a dense and close - range pressing mode, the rhythm of their passing and control is disrupted, which affects the continuity of their offense and the threat in theAHKOR D1
Jeonbuk Hyundai Motors
0-0
FC Seoul
Panji SuryonoJeonbuk Hyundai Motors has long been refining a meticulous midfield passing and control suppression system. The midfielders in the team have a high - level of coordination and rotation. They are good at using continuous ball control and passing to force the opponent's defense to adjust their positions passively and gradually gain the initiative on the field. The team's overall competitive state is consistent and stable, with highly mature tactical implementation. In the recent five games, the average ball - possession rate has reached 55%, and the overall passing success rate is 63%. Their ability to continuously apply pressure and control the game in the front court during positional play is remarkable. However, Jeonbuk Hyundai's ability to adapt to high - intensity physical confrontation is average. When the opponent starts a dense and close - range pressing mode, the rhythm of their passing and control is disrupted, which affects the continuity of their offense and the threat in theAHKOR D1
Jeonbuk Hyundai Motors
0-0
FC Seoul
 KOR D1
More Recommend
-
I'm a professional analyst who selects and analyzes matches daily. Hergen has shown greater conversion efficiency at the offensive end. In recent matches, their offensive conversion rate stands at 21%, outperforming Kalmar's 14%. Their xG efficiency is 1.82 per 90 minutes, leading by 0.35. In the passing network, Hergen's key passing success rate is 68%, suppressing Kalmar's 52%. Their passing value in the front - field is 1.23 per 90 minutes, 0.42 higher than Kalmar. Regarding midfield control, Hergen has an average of 12.7 successful interceptions and 15.3 tackles per game, which effectively facilitate offensive transitions. They also cover a running distance of 112.4 km and make 18 high - intensity sprints per game, both of which are superior to Kalmar. Carlma's defensive statistics are less impressive. They average 11.2 clearances and 9.8 interceptions per game, trailing behind Häcken's 14.4 and 13.6 respectively. Their back - line passing success rate is only 59%. On the offensivAH
 SWE D1
Hacken
-
Kalmar
SWE D1
Hacken
-
Kalmar
-
Frederikstad has shown a decent attacking end conversion rate of 18.3%, ranking 4th in the Norwegian Premier League. However, their xG efficiency stands at only 0.62, which is lower than the league average. On the other hand, Sandefjord leads the league with a key - pass success rate of 67%. Their forward - field passing value reaches 12.8 times per 90 minutes. The home team, Frederikstad, has a midfield interception rate of 19.2 times per 90 minutes. But their transition speed is only 1.8 times per minute, falling behind the away team, Sandefjord, which has a rate of 2.3 times per minute. Sandefjord also has a higher intensity on the field. They have 28 full - field high - intensity sprints, 6 more than the home team, and their running distance reaches 112.3 kilometers. I have a professional team and can provide in - depth analysis of selected football matches every day. Sanderfjord's defense stands out in the league, with 15.7 tackles per 90 minutes, placing them among the top three.AH
 NOR D1
Fredrikstad
-
Sandefjord
NOR D1
Fredrikstad
-
Sandefjord
-
I'm an analyst with a professional team, dedicated to providing in - depth analysis of selected football matches daily. In this football encounter, Rahiti shows a significant edge over Yaro in multiple aspects. In terms of offensive conversion rate, Rahiti's 22% is better than Yaro's 16%. The xG efficiency of Rahiti is 0.82, higher than Yaro's 0.59. Regarding key passes, Rahiti has a success rate of 68%, leading Yaro's 52%. The value of forward passes for Rahiti is 14.3, which is more threatening compared to Yaro's 9.1. In midfield control, Rahiti averages 11.2 tackles and 8.4 interceptions per game. The transition speed of 1.8 seconds is faster than Yaro's 2.3 seconds. In addition, Rahiti's running distance reaches 112.4km, longer than Yaro's 108.6km, and they have 15 more high - intensity sprints. All these factors suggest that Rahiti may have an advantage in this game. Yaro's defensive statistics are inferior to Lahti's. Yaro has 18 clearances, which is lower than Lahti's 24. Its inO/U
 FIN D1
Lahti
-
Jaro
FIN D1
Lahti
-
Jaro
 SWE D1
 NOR D1
 FIN D1
Comments
All
By Author
Me
Post